Statistics
Scilab provides tools to perform data analysis and modeling.
Descriptive statistics
median — median (row median, column median,…) of vector/matrix/array entries
stdev — standard deviation (row or column-wise) of vector/matrix entries
variance — variance (and mean) of a vector or matrix (or hypermatrix) of real or complex numbers
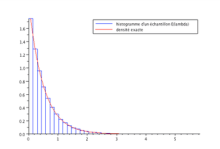
Probability distributions
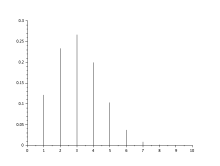
Example with the binomial distribution probabilities:
![]()
n=10;p=0.3;
plot2d3(0:n,binomial(p,n));
More on wikipedia
Linear and nonlinear modeling
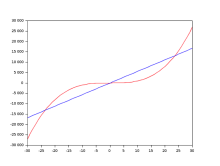
The simplest example is a Linear regression:
x = -30:30; y = x.^3;
[a, b] = reglin(x, y);
plot(x, y, "red")
plot(x, a*x+b)
Machine learning
Scilab provides tools to perform predictive analytics and machine learning for both:
- supervised learning
- unsupervised learning
Supervised learning is a most common kind of machine learning approach. It basically works with a set of “right answers” that is being used for the learning phase.
Unsupervised learning on the opposite does not require to have a training set a labeled data. It automatically identifies the hidden structure behind the dataset, and group them in a certain number of classes defined by the user.
Regression
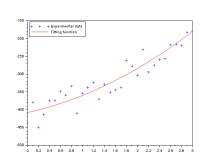 A regression problem deals with the prediction of a continuous function.
This example coming from the Scilab demos is a polynomial regression:
function y=FF(x)
    // parametric function model
    y = a*(x-b)+c*x.*x;
endfunction

exec SCI/modules/optimization/demos/datafit/datafit.dem.sce;
Classification
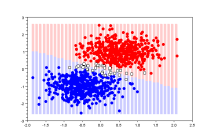 A classification problem predicts discrete-valued outputs of a function.
This kind of problems can be addressed with support vector machines, implemented in the Scilab toolbox LibSVM.
Find out more with this tutorial in english.